Pages

Tuesday, June 3, 2014

BQ#7: Unit V: Deriving the Difference Quotient

How do you derive the difference quotient?

  • To answer this question, we must first look at a couple of formulas and remember that we are basically going from step to step in order to achieve this end result. 
(http://images.tutorvista.com/cms/images/39/difference-quotient-formula.png)

         Really the only formula we will be using in order to get to the difference quotient is the slope formula because we need to find the slope of a line that goes through two points on the function graph called the secant line.

(http://www.algebra-class.com/image-files/slope-formula-2.gif)

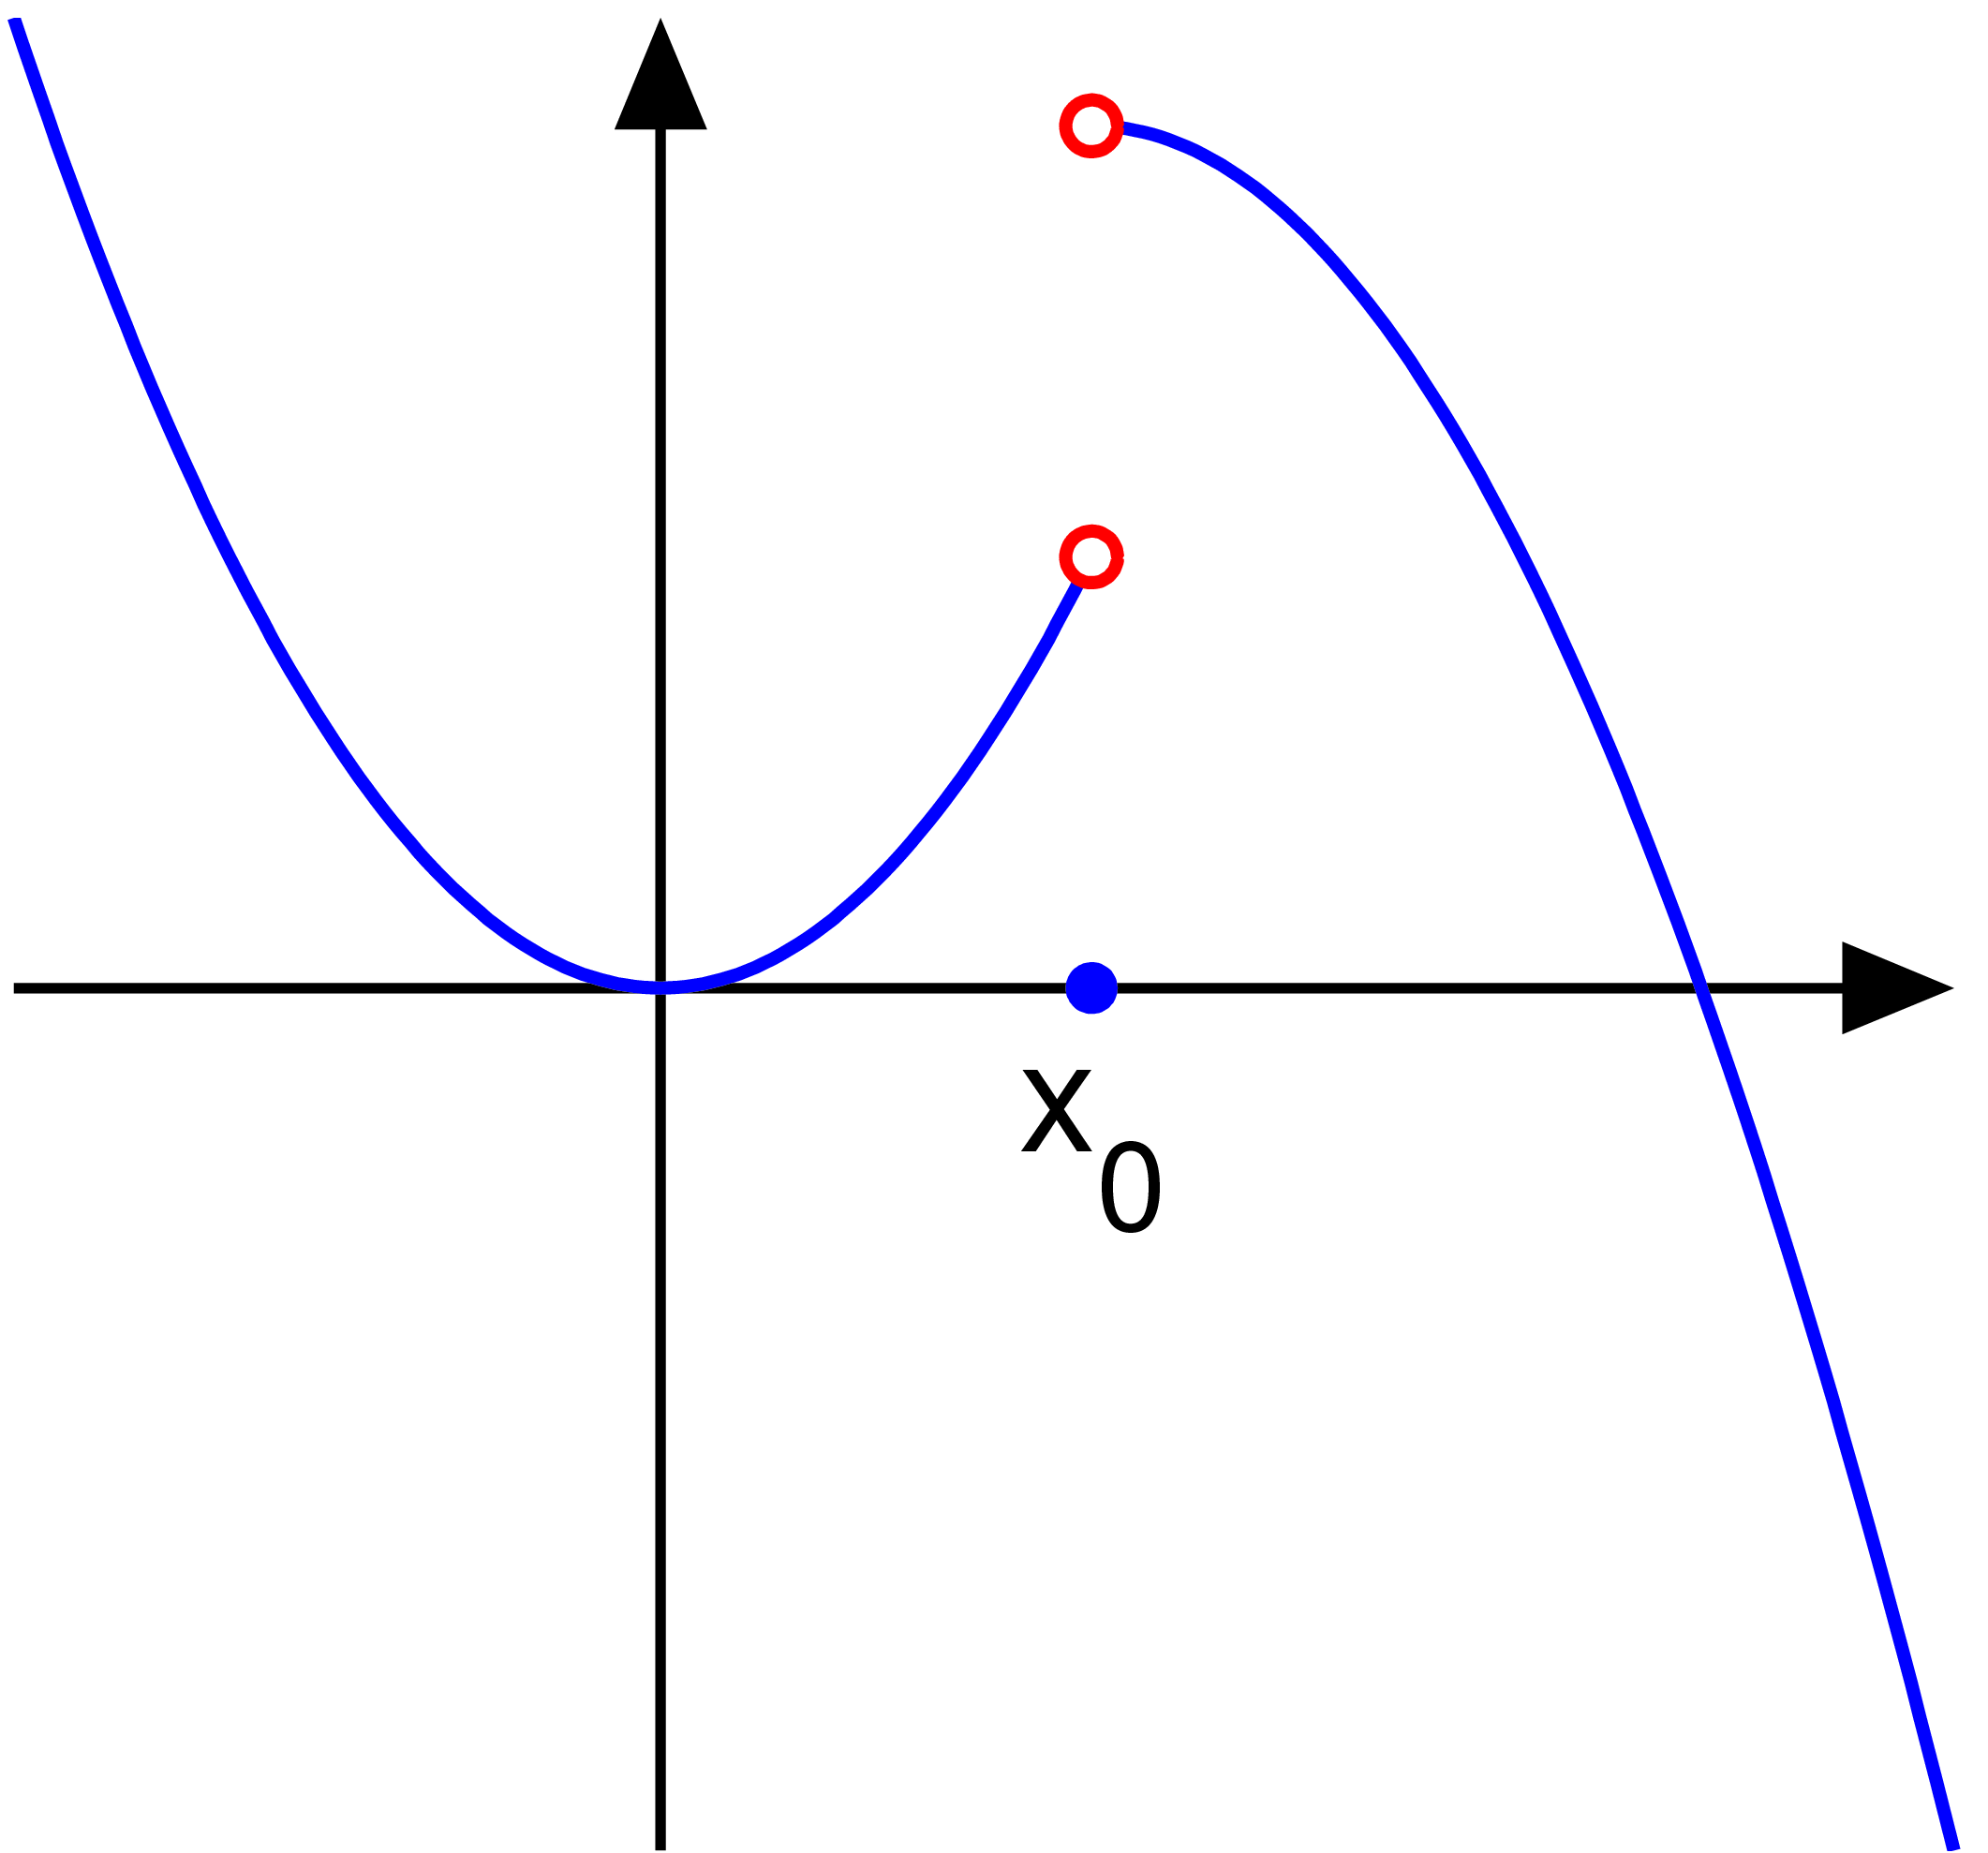
            But for now lets look at this picture and break it down to see how we get the points we need...
(http://cis.stvincent.edu/carlsond/ma109/DifferenceQuotient_images/IMG0470.JPG)

  • On a graph of a function, assuming we don't have units labelled and all, we have no idea of knowing the exact value of those points we need. However, we can name the distance on the x-axis with a certain variable named x. Using this, we can add on this value of x with another variable that we will call h in order to get the distance to our second point on the x-axis. To get the necessary y-values, we just find the function of the x-values like we normally would with a function graph. Since we don't know the actual values, we leave both as f(x+h) and f(x)

  • The secant line is represented by these two points and now all we have to do is plug it into our slope formula to get our difference quotient. Remember that our first point is ( x, f(x)) and our second is (x+h, f(x+h)). Look back at the slope formula if you get lost. 


  • Still confused? This video gives a good explanation on the entire process if you need more help.


References

http://images.tutorvista.com/cms/images/39/difference-quotient-formula.png
http://www.algebra-class.com/image-files/slope-formula-2.gif
http://cis.stvincent.edu/carlsond/ma109/DifferenceQuotient_images/IMG0470.JPG


https://www.youtube.com/watch?v=XA0fZh8cXV8


Sunday, May 18, 2014

BQ #6: Unit U Concepts 1-8: Review

1. What is continuity? What is discontinuity?


  • Continuity on a graph is signified by 4 different things that we can observe. One is that a continuous graph will have no holes, jumps, breaks, or oscillating movements that may cause a discontinuity. Obviously the two are opposites of each other but can describe two different things just like we have here. To move on, a continuous graph must also be predictable, have the value and the limit be the same, and have the ability to be drawn in one continuous stroke of a pencil. Here are the four types of discontinuities that stop a continuous graph from living the good life of continuity. 
http://webpages.charter.net/mwhitneyshhs/calculus/limits/limit-graph8.jpg
http://upload.wikimedia.org/wikipedia/commons/e/e6/Discontinuity_jump.eps.png
http://dj1hlxw0wr920.cloudfront.net/userfiles/wyzfiles/4a69dec7-03e0-492f-ac16-4dcd555579c9.gif
http://dj1hlxw0wr920.cloudfront.net/userfiles/wyzfiles/44bad38c-431e-4382-8fe9-86303561b2a0.gif


2. What is a limit? When does a limit exist? When does a limit not exist? What is the difference between a limit and a value?

    http://dj1hlxw0wr920.cloudfront.net/userfiles/wyzfiles/4a69dec7-03e0-492f-ac16-4dcd555579c9.gif
  • In simple terms, a limit is an intended height that exists when a graph is continuous. A limit does not exist when there is a jump, infinite, or oscillating discontinuity. The difference between a limit and a value is that a limit is the intended height and the value is the actual height that is reached. These two can be different as seen in this graph above which has a point discontinuity. The value is the dark dot and the limit is the hole. 

3. How do we evaluate limits numerically, graphically, and algebraically?

  • We evaluate limits numerically by using tables and using tenth gaps between out numbers and our limit numbers for our x and y. We evaluate limits graphically by using our two fingers to trace out the limit on the graph. And to evaluate algebraically, we employ a list of tools such as substitution, rationalizing to make substituting easier, and dividing out by the biggest x for limits at infinity. 
                               

Resources: 

http://dj1hlxw0wr920.cloudfront.net/userfiles/wyzfiles/44bad38c-431e-4382-8fe9-86303561b2a0.gif
http://webpages.charter.net/mwhitneyshhs/calculus/limits/limit-graph8.jpg
http://upload.wikimedia.org/wikipedia/commons/e/e6/Discontinuity_jump.eps.png
http://dj1hlxw0wr920.cloudfront.net/userfiles/wyzfiles/4a69dec7-03e0-492f-ac16-4dcd555579c9.gif


Monday, April 21, 2014

BQ #4: Unit T Concept 3: Tanget and Cotangent Behavior

 
  1. Why is a “normal” tangent graph uphill, but a “normal” Cotangent graph downhill? Use unit circle ratios to explain.
  •  The reason for this behavior in a tangent graph and a cotangent graph is quite simple. It lies in the fact that tangent and cotangent have asymptotes in different spots on their graphs. This is  because tangent and cotangent graphs may have the same positive/negative pattern but since they have different ratio identities, they have different asymptotes
  • If we remember how we get an asymptote, it is when we divide by zero and since tangent has the denominator cosine and cotangent has the denominator sine, the asymptotes will be in different spots. We can clearly see in this picture the difference between the asymptotes in both graphs. 
(http://www.analyzemath.com/trigonometry/graph_cotangent.gif)
(http://www.analyzemath.com/trigonometry/graph_tangent.gif)    


References

http://www.analyzemath.com/trigonometry/graph_tangent.gif
http://www.analyzemath.com/trigonometry/graph_cotangent.gif


Sunday, April 20, 2014

BQ #3: Unit T Concepts 1-3: Relations of Sin and Cos to Other Graphs


  1. How do the graphs of sine and cosine relate to each of the others?  Emphasize asymptotes in your response.
  • For these graphs we will be looking at the quadrants and the relations they have to our sine and cosine graphs. We will also be using a little bit of identities and asymptote knowledge in order to find the special relation.


  • Tangent
Sine and cosine are related to the tangent graph when we are looking at the sign of the tangent graph. We know that tangent equals sine/cos as a ratio identity so if one of the graphs is negative then tangent will be negative. If both of the graphs are either positive or negative then the tangent graph will be positive.

If we look at this picture, the pattern fits perfectly for each quadrant where there is sometimes a switch in positive or negative. Watch as the tangent graph goes up or down according to its asymptotes as well.

  • Cotangent
This is the same pattern for cotangent where if one is negative than cotangent is also negative. The asymptotes are in a different location but this will be gone into further detail in BQ#4.


  • Secant
We are going to be looking at something different for secant and cosecant graphs. For these graphs we will only look at one of the sine and cosine graphs to find the relation between them. For a secant graph, it is related to a cosine graph because the reciprocal of cosine is secant. We can also use this information to spot where the asymptotes will be so in this case the asymptotes will be where cosine equals zero.


What we can also see from this picture is that as the cosine value on the graph goes towards zero, the secant graph will spike up to ridiculous numbers. This is because the reciprocal of a very small number or a fraction in this case equates to a very large number. We also see that when the y value equals 1 or -1 on the cosine graph, the secant graph also has that same value because the reciprocal of 1 is 1.


  • Cosecant
Now for a cosecant graph, the partner we should be focusing on is the sine graph and the same reciprocal rule still applies. Of course the asymptotes will now be in different positions because we are dealing with a different graph but the same rules still apply as seen in this picture.


References

  • All images screenshot from https://www.desmos.com/calculator/hjts26gwst
  • http://www.schooltube.com/video/d868e626798142e4b88c/Secant%20with%20Cosine.mp4
  • http://www.schooltube.com/video/0cb4440c15b14be0bcb6/CoSecant%20with%20sine.mp4


Thursday, April 17, 2014

BQ #5: Unit T Concepts 1-3: Asymptotes


  1. Why do sine and cosine NOT have asymptotes, but the other four trig graphs do? Use unit circle ratios to explain
  • To answer this question, we must first look at the unit circle ratios to better understand how we are getting these asymptotes.
(http://htmartin.myweb.uga.edu/6190/resources/trigfunctions.gif)
           
              Lets break this question up into two parts and answer the sine and cosine part first. If we remember correctly, an asymptote is a result of an undefined value or a value where something is divided by zero. If we look at the ratios for sine and cosine, their denominators have a very specific value called r. R will always equal one value on a unit circle which is the value of 1, and if this is the case,  we will never get asymptotes with sine and cosine. 
             Now if we look at the other four trig graphs we see that their denominators are not constant values, they may change depending on what x or y is. So these trig graphs can have asymptotes as opposed to sine and cosine. 

References

http://htmartin.myweb.uga.edu/6190/resources/trigfunctions.gif

Wednesday, April 16, 2014

BQ# 2: Unit T Concept Intro: Trig Graphs and the Unit Circle


  1. Trig Graphs and their Relation to the Unit Circle
  • Trig graphs relate to the unit circle because their signs depend on what quadrant they are in when looking at a unit circle. For example a sine function will be positive in quadrants I and II while being negative in quadrants III and IV.
     2. Why is the period for sine and cosine 2pi, whereas the period for tangent and cotangent is pi?

  • The period is 2pi for sine and cosine because of their pattern on the unit circle repeats after every four marks on a graph. If we measure our x-axis by pi/2 each mark, it would take a full revolution around the unit circle because it has 4 of these as quadrant angles each represent a pi/2 and for sine and cosine, the sign pattern is +,+,-,-. Which means that it won't repeat after it has passed four marks. For tangent and cotangent ,however, its pattern is +,-,+,- and you can clearly see that it repeats just by going to two marks. Two marks on our x-axis would equal to just one pi.
Look at these sine and cosine graphs for example and notice their quadrant signs and how they go all the way to pi.
(http://www.regentsprep.org/Regents/math/algtrig/ATT5/unitcirclecowine.gif)


(http://www.regentsprep.org/Regents/math/algtrig/ATT5/sine77.gif)
          Now look at these tangent and cotangent graphs and notice that they immediately start repeating just after two marks, or just pi on the x-axis. 
(http://www.analyzemath.com/trigonometry/graph_cotangent.gif)
(http://www.analyzemath.com/trigonometry/graph_tangent.gif)


              3.How does the fact that sine and cosine have amplitudes of one (and the other trig functions don’t have amplitudes) relate to what we know about the Unit Circle?
  • Sine and Cosine have amplitudes of one because they have restrictions on the range of their graphs. When we look at tangent and cotangent they go up to infinity and down to negative infinity because they don't have these restrictions. But sine and cosine have the restriction of 1 because on the Unit Circle simple because anything greater than 1 for sine and cosine is no solution. Here's an image showing the difference in range between a sine graph and a cosecant graph. 
(http://learn.roguecc.edu/mathematics/chutt/Math112/Intro/OtherTrigonometricFunctionsDay1_files/image004.png)


References


http://learn.roguecc.edu/mathematics/chutt/Math112/Intro/OtherTrigonometricFunctionsDay1_files/image004.png
http://www.analyzemath.com/trigonometry/graph_tangent.gif 
http://www.analyzemath.com/trigonometry/graph_cotangent.gif
 
http://www.regentsprep.org/Regents/math/algtrig/ATT5/sine77.gif
http://www.regentsprep.org/Regents/math/algtrig/ATT5/unitcirclecowine.gif


Thursday, April 3, 2014

Reflection #1: Unit Q Verifying Trig Identities


  1. What does it actually mean to verify a trig identity?
  • When you verify a trig identity you are basically reordering it to have it equal to whatever value you want it to equal. Think of it it like a conversion problem, to get to another unit you have to do something to the original value, maybe divide it by a certain number. When you are verifying trig identities, you are using separate identities to change your trig function into an entirely different trig expression. 


      2. What tips and tricks have you found helpful?
  • The tips and tricks I have found helpful were the ones that were taught to me, there isn't really much you can learn off your own knowledge, you have to follow specific rules to these problems. These rules are like never dividing by a trig function and just knowing what strategy to use in what situation. It is like a student making up entirely different conversion factors by saying a mile now equals 5 feet, which is entirely wrong. He has to follow the given conversion factor or he will get the question wrong, so in a sense these problems are about 80% memorization of strategies and rules. 

        3. Explain your thought process and steps you take in verifying a trig identity.  Do not use a specific example, but speak in general terms of what you would do no matter what they give you.

  • From what I have learned through all my practice in this unit, verifying trig identities is all about knowing the right first step. It doesn't really matter if you mess up the next steps because you can start again but as long as you get a good start on where to go in a trig identity, you are given options on what to do next. I also pay attention to what I have to verify to so I can keep in mind what identities to use in the problem. The most important detail about what goes through my head when solving this problem is that I cannot over-complicate it. If I do over-complicate a problem, not only am I going in the wrong direction, but I exhaust myself trying to think of ridiculous ways to finish the problem. The steps should be simple, straightforward, and in the right direction. 

Wednesday, March 26, 2014

SP #7: Unit Q Concept 2: Finding all trig functions using idenitites

Please see my SP7, made in collaboration with Michael C. who is incredible with coming up middle nicknames by visiting their blog post here. Also be sure to check out all the other crazy blog posts and his WPP story because it's funny on his blog here.

Wednesday, March 19, 2014

I/D #3: Unit Q Concept 1: Pythagorean Identities

Inquiry Activity Summary


1.       The Pythagorean Identity comes from a derivation of the Pythagorean Theorem and we can basically call it an identity because it is a proven fact, which will be shown later in the work.

        From this picture we have the standard Pythagorean Theorem and we will be replacing it with trig functions. We use the values of sine and cosine in the side values and we use the hypotenuse of r which will always equal 1. We know this because we are solving with values from a unit circle. We then see that we can the whole thing by r which will basically leave it in the form known as one of the Pythagorean Identities. We then use 45° angle to prove this identity and thus fulfilling its definition, but how do we find the other two?


2.       The other two identities are found in just a few easy steps or rather one step and a few glances at the identities chart.


       As you can see we are really only dividing by sine or cosine and figuring out what each value produces in terms of different identities. So for example in the first part where we are trying to derive for the secant and tangent one, we find that tangent equals sin over cosine


Inquiry Activity Reflection


1. The connections that I see between Units N, O, P, and Q so far are that when we are deriving for these identities, we use values found on the unit circle from Unit N like the radius always equaling 1 which is very convenient for us. I also see a connection between P and Q because of the way we are deriving things from one to another reminds me of how we get the Law of Cosines and Law of Sines. It may seem like they are two entirely different things but they are actually connected together with a little math. 

2. If I had to describe trigonometry in three words, they would be connectable mathematical equations. 


Tuesday, March 18, 2014

WPP #13-14: Unit P Concepts 6-7: Law of Sine and Law of Cosine

This WPP13-14 was made in collaboration with Michael C. from the same class.  Please visit the other awesome posts on their blog by going here


Create your own Playlist on LessonPaths!

Sunday, March 16, 2014

BQ #1: Unit P Concepts 3-4: Deriving Law of Cosines and Area of an Oblique Triangle

3. Law Of Cosines Derivation 


(http://www.regentsprep.org/Regents/math/algtrig/ATT12/cosineprooof.gif)

          
We need the Law of Cosines because it tells us the information of a non-right triangle for a SAS triangle, or a triangle that gives us two sides and the included angle, and a SSS triangle or a triangle that gives us all three sides. Lets take a look at the triangle above, we have cut it in half and we get two right triangles and we want to find the value of side a. If we imagine the triangle on a coordinate plane, we can use the distance formula to solve for side a. The distance formula of course asks for the coordinates of the two endpoints of whatever it is you are trying to find the actual distance of. In this case we need to find the coordinates of B and C.
(http://geometry.jdeer.com/Images/c1/distance%20formula.gif)


              So lets start by trying to figure out what coordinates we have in the next picture, 

(http://www.regentsprep.org/Regents/math/algtrig/ATT12/derivelawofsines.htm)

                This actually shows the Pythagorean part of the derivation but we find the coordinates easily. Here we have c sin A squared and b - cos A squared because we only want that specific side when we will be using the Pythagorean Theorem (remember we can do this because we cut the triangle into two right triangles). If you wondered where are the coordinates, they are right there, its just that when we are on the coordinate plane, we are on the x-axis, so we really only care about the x value. We get the value of h from cSin a and the value of the section of b we want with b - cosA. Once we finish the math we get a value in parentheses that is sin squared A + cos squared A which equals to 1 so we can get rid of it. The final answer is what we use in the Law of Cosines. 


Still confused? Watch this video for extra help. 


4. Area Formula of an Oblique Triangle 

              The area of an oblique triangle is derived using trig functions and is drawn in a way that has one right triangle to make things a bit easier. 

(http://www.compuhigh.com/demo/lesson07_files/oblique.gif)


             The area of a triangle as we all know is half its base times its height. When we use trig functions on the triangle on the left, we know that h = asinC because sinC = h/a. Keep in mind that the h will not be automatically drawn on any oblique triangles, we are just imagining the line to help us derive.The same goes for the triangle on the right but this time we use sinA = h/c and we move around the formula as needed. So now that we have the value of our h we can just substitute it into our regular formula and we get the following three formulas depending on what we have. 


(http://1.bp.blogspot.com/-8b_dCmFCE54/TfY9T7utD3I/AAAAAAAAAC4/U4iJhEhMAMU/s400/hi.bmp)


Notice that we substitute the height correctly by what they give us, so we need to pay special attention to what sides they give us in order to find the area. 


References: 

http://www.algebra.com/algebra/homework/Trigonometry-basics/THEO-2012-01-16.lesson
http://www.regentsprep.org/Regents/math/algtrig/ATT12/derivelawofsines.htm
http://www.compuhigh.com/demo/lesson07_files/oblique.gif
http://geometry.jdeer.com/Images/c1/distance%20formula.gif
http://1.bp.blogspot.com/-8b_dCmFCE54/TfY9T7utD3I/AAAAAAAAAC4/U4iJhEhMAMU/s400/hi.bmp
http://www.youtube.com/watch?v=_DR0BfWh5Jk
http://www.regentsprep.org/Regents/math/algtrig/ATT12/cosineprooof.gif


Tuesday, March 4, 2014

I/D #2: Unit O: Concepts 7-8: Deriving the SRTs

Inquiry Activity Summary

1. 30-60-90


             To follow this image, view from right to left starting with what we were given first, an equilateral triangle with sides all equaling 1. Since it's an equilateral triangle, we will also have all angles equal to 60°. We cut the triangle down it's altitude because we want to have right triangles, in this case we get two of them but notice that one of the angles is now 30°, one of the sides is unknown, which happens to be the longer leg, and the shorter leg has been halved to 1/2. 
            To find the unknown side, we use the Pythagorean theorem  but instead of using 1/2 we should double it so that we can have an easier time solving for it. We can do this because the triangle would still hold proportionate to a 30-60-90 as long as we double the other known side. We find the unknown side to be √3 and we set up our values into a special ratio for our special right triangle by putting n into the values so it can fit any 30-60-90 triangle as long as it fits the ratio. 


2. 45-45-90


              Once again start with what we were given, this time a square with all sides equaling 1 and the angles each being 90°. We cut across this square to get our two right triangles, both having sides equaling 1 and having two 45° angles but now their hypotenuse has an unknown value. To find this unknown value you use the Pythagorean Theorem and you get √2. We have our final values and turn them into the special ratio for our 45-45-90 triangle by using n as a variable for any other special right triangles we may have to make sure the sides correspond to the ratio of 1, 1, and radical 2.


Inquiry Activity Reflection


1. Something I never noticed before about special right triangles is that they can be constructed from other shapes. To go into more detail I just thought they were weird triangles that had special rules attached to them but they actually appear in a lot of places. 


2. Being able to derive these patterns myself aids in my learning because it gives me an idea of where these special rules come from and how they come together. 


Saturday, February 22, 2014

I/D#1: Unit N: Concept: 7: How Do SRT and UC relate?

Inquiry Activity Summary


  1. The 30­° Triangle 
(http://www.gradeamathhelp.com/image-files/30-60-90-triangle.jpg)


                Before we begin to solve the special right triangle section of the unit circle, we must first follow the special right triangle rules as shown in the first picture. For this triangle, we start from the 30° angle and move from there. So the hypotenuse will stay the same as the 2 value, but the side opposite from our angle will be the 1 value because that is what is next to the x in our rule and the side that will be horizontal will have a set radical 3 value. We will also pretend the triangle is on a coordinate grid where the horizontal side is basically the y value and the vertical side is the x while the hypotenuse will take the radius value.
              Now we can solve for this special right triangle with the parameters given. Since we are solving for a section of a unit circle, the radius always has to be one so there is one value given. To get to the value, we must divide the hypotenuse by 2 and do the same for each side. The y value becomes 1/2 and the x value becomes radical 3 over 2. The coordinates are easy to plot if you are still imagining a coordinate grid and are shown next to the corners of the triangle, with our origin starting at the 30°. 


   2. The 45° Triangle

(http://www.gradeamathhelp.com/image-files/45-45-90-triangle.jpg)


                 What we did previously will now be used to solve for this triangle. Now we have a 45 45 90 right triangle and we are starting from one of the 45° angles. Use the new set of special right triangle rule for this triangle and now we have to divide the hypotenuse by radical 2 to get our desired one value. Do that division for each side and now You have your x and y values as labelled in the right picture. Remember you cannot have a radical in the denominator so make sure you multiply by a radical over radical value to get rid of that radical. This time the ordered pairs are circled a midst all the work that is shown. 


  3. The 60° Triangle


(http://www.gradeamathhelp.com/image-files/30-60-90-triangle.jpg)


              Truth be told the resourceful learner would just use the values solved for in the 30° triangle and switch them accordingly. But an explanation will be provided for the slower learners in the crowd. We use the same rule for our 60° triangle as the first one because it is apart of the same 30,60,90 triangle, and we still divide the hypotenuse by 2 to get our desired 1 value and do the same thing for the other sides. But now we must switch the x and y values we had because the angle we are starting from is different. We must also pay careful attention to our coordinates because our values have been switched. The coordinates are circled again and the x and y values have been changed so make sure you read carefully.

 4. How does this help you derive the unit circle

        This triangle activity helped me figure out why the coordinates change as I go through a unit circle. It makes perfect sense now that I look at it, the unit circle is just composed of a bunch of triangles. The coordinate we care about is the one that is connected to the y value and the hypotenuse, that is where I figured out why we have such crazy numbers like radical 3 over 2. It also helps me remember what coordinates go where for the unit circle because now I look at the unit circle like a grid where the radius is always 1. Here is a picture I found that better illustrates the idea that these triangles fit in the unit circle. 
(http://upload.wikimedia.org/wikipedia/commons/thumb/9/94/Special_right_triangles_for_trig.svg/220px-Special_right_triangles_for_trig.svg.png)

 5. What quadrant does the triangle drawn in this activity lie in?  How do the values change if you draw the triangles in Quadrant II, III, or IV?  Re-draw the three triangles, but this time put one of the triangles in Quadrant II, one in Quadrant III, and one in Quadrant IV.  Label them as you did in the activity and describe the changes that occur.

The triangles drawn in this activity belong in quadrant I because we start from the origin and go right on the x axis and our triangle points upwards into quadrant I. The values change signs whenever we move them into other quadrants, but as long as we keep the same angle, the values will stay the same. For example the x and y value will be negative in quadrant III and only the y value will be negative in quadrant IV. Lets draw a each angle in a different spot to see these differences.

Here we have a 45° angle in quadrant II. The only thing that changes here is the sign for the x value and you can clearly see that the coordinate changes accordingly. The x and y value are labelled here to show you the difference. 

Here we have a 30° angle in quadrant III. This time both the x and the y value change signs as represented in the image, The coordinate value changes signs while in this quadrant as well. 


Here we have a 60° angle in quadrant IV and this time only the y value changes signs as seen in the labels above.

Inquiry Activity Reflection

The coolest thing I learned from this activity was how the unit circle changes values according to rules for a triangle. I have always wondered about the similarity between triangles and circle when eating a pizza but I've never really put too much thought into it.

This activity will help me in this unit because simply put, it will make filling in the unit circle much easier. Although I still like memorizing it a lot more than this.

Something I never realized before about special right triangles and the unit circle is how closely related they are to each other. Special right triangles are the reason we have such wonky numbers in our unit circle when we are filling out the coordinates. 


Monday, February 10, 2014

RWA1: Unit M Concepts 4-6: Conic Sections in Real Life


RWA: Ellipse Conic Section

  1. Definition: "The set of all points such that the sum of the distance from two points is a constant." (http://www.lessonpaths.com/learn/i/unit-m-conic-section-applets/ellipse-drawn-from-definition-geogebra-dynamic-worksheet)
  2. Description: 
  • Algebraically: 
    (http://www.clausentech.com/lchs/dclausen/algebra2/ellipses.htm)
    Two different ways the equation can be written, both producing an ellipse. How each is read and graphed will be explained in more detail later.


  • Graphically: Ellipse is an oval-shaped graph that has a major solid axis and a dotted minor axis. There is a focus graphed inside the ellipse and the center lies, obviously, in the center. Refer to the picture to figure out whether the ellipse will be horizontal or vertical. Points are also graphed on the endpoints of both axis. 
  • Key Features: 


  •  http://media.wiley.com/Lux/94/219994.image1.jpgHere are all the key features of an ellipse. The center is not listed here but it is obviously the center and is found by the simple h.k rule from the equation, just take the h,k value and the opposite signs of those numbers are your center. The way you find the vertex is taking the square root of the bigger value or the "a" value and adding it and subtracting it either the h or k value whether its horizontal or vertical, view the previous image to better understand. The minor axis is found the same way but with the smaller "b" value. Both of these are found as the denominators and have axis that cross through them all the way to the center. The axis that crosses the vertex is usually solid and is called the major axis. The one that crosses the co-vertex is called the minor axis and is usually dotted. For more information visit http://www.clausentech.com/lchs/dclausen/algebra2/ellipses.htm .
  • Foci and Eccentricity: The foci are found by finding the c value through the equation a^2-b^2=c^2 where a must be greater than b. The value of c is then added and subtracted to either the h or k value in the same way the a value was added and subtracted. Foci dictate how circular the ellipse is, if it is closer to the center then it is more circular. The eccentricity or the value of c/a will always be less than one for an ellipse. 
  • Further Help on Graphing an Ellipse: 


3. Real World Application: Probably the most common occurence of ellipses is in space. The way gravity works makes orbit travel not in a perfect circle, but in a fixed ellipse. 

(http://britton.disted.camosun.bc.ca/elliorbit.GIF)
One perfect example of this fixed path is Halley's Comet, which was discovered by Edmund Halley. "Halley's Comet takes about 76 years to travel abound our sun. Edmund Halley saw the comet in 1682 and correctly predicted its return in 1759. Although he did not live long enough to see his prediction come true, the comet is named in his honour."(http://britton.disted.camosun.bc.ca/jbconics.htm) Halley's Comet chooses this path in a way that it cuts through space like a conic section would normally do. Here is a video describing the comet in full detail and a better view of it's ellipse path.


4. Works Cited: